Add assay data

Ok, I think I understand. The study is used to describe the overall experiment and the sample generation. Then the assays are used to describe the individual lab processes and the data generation!
Right! In assays you can store data and metadata from measurements.
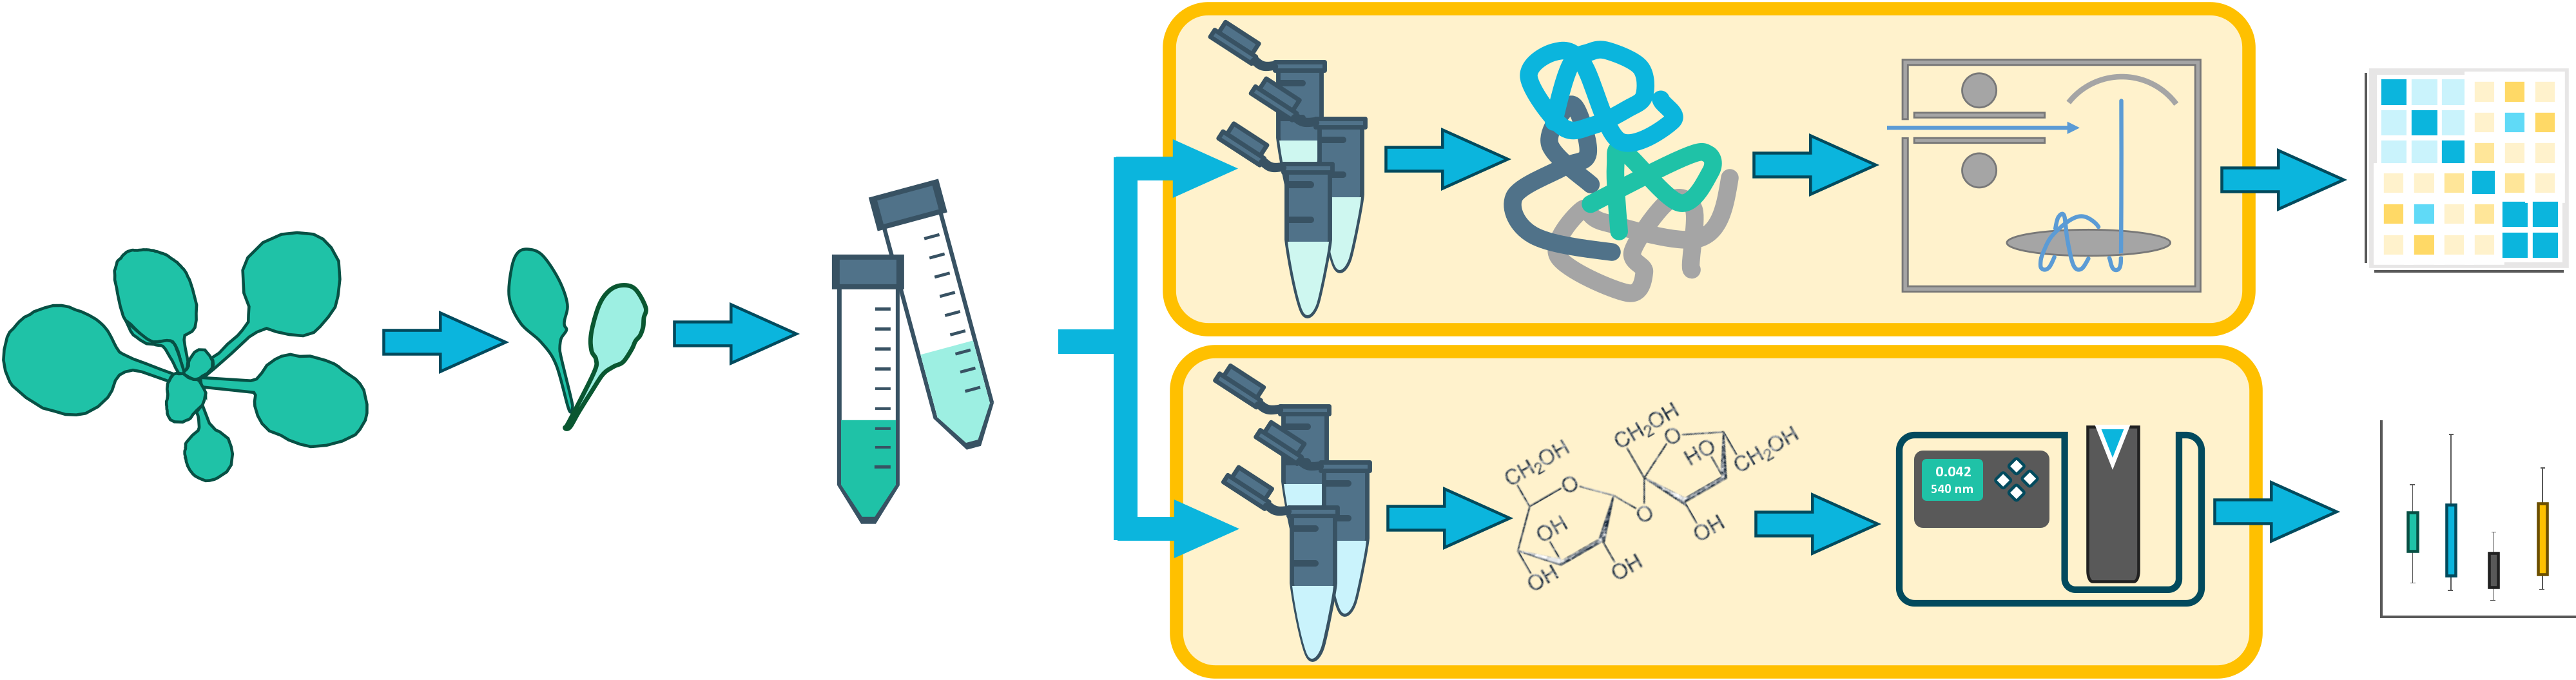
You can have multiple assays in one ARC. Each assay can have its own metadata, data, and protocols. How you structure your assays is up to you.
In general it is a good approach to describe each logical process in a separate assay.
Then let’s start with the “Sugar Measurement” assay.
Assay: Sugar Measurement
Section titled “Assay: Sugar Measurement”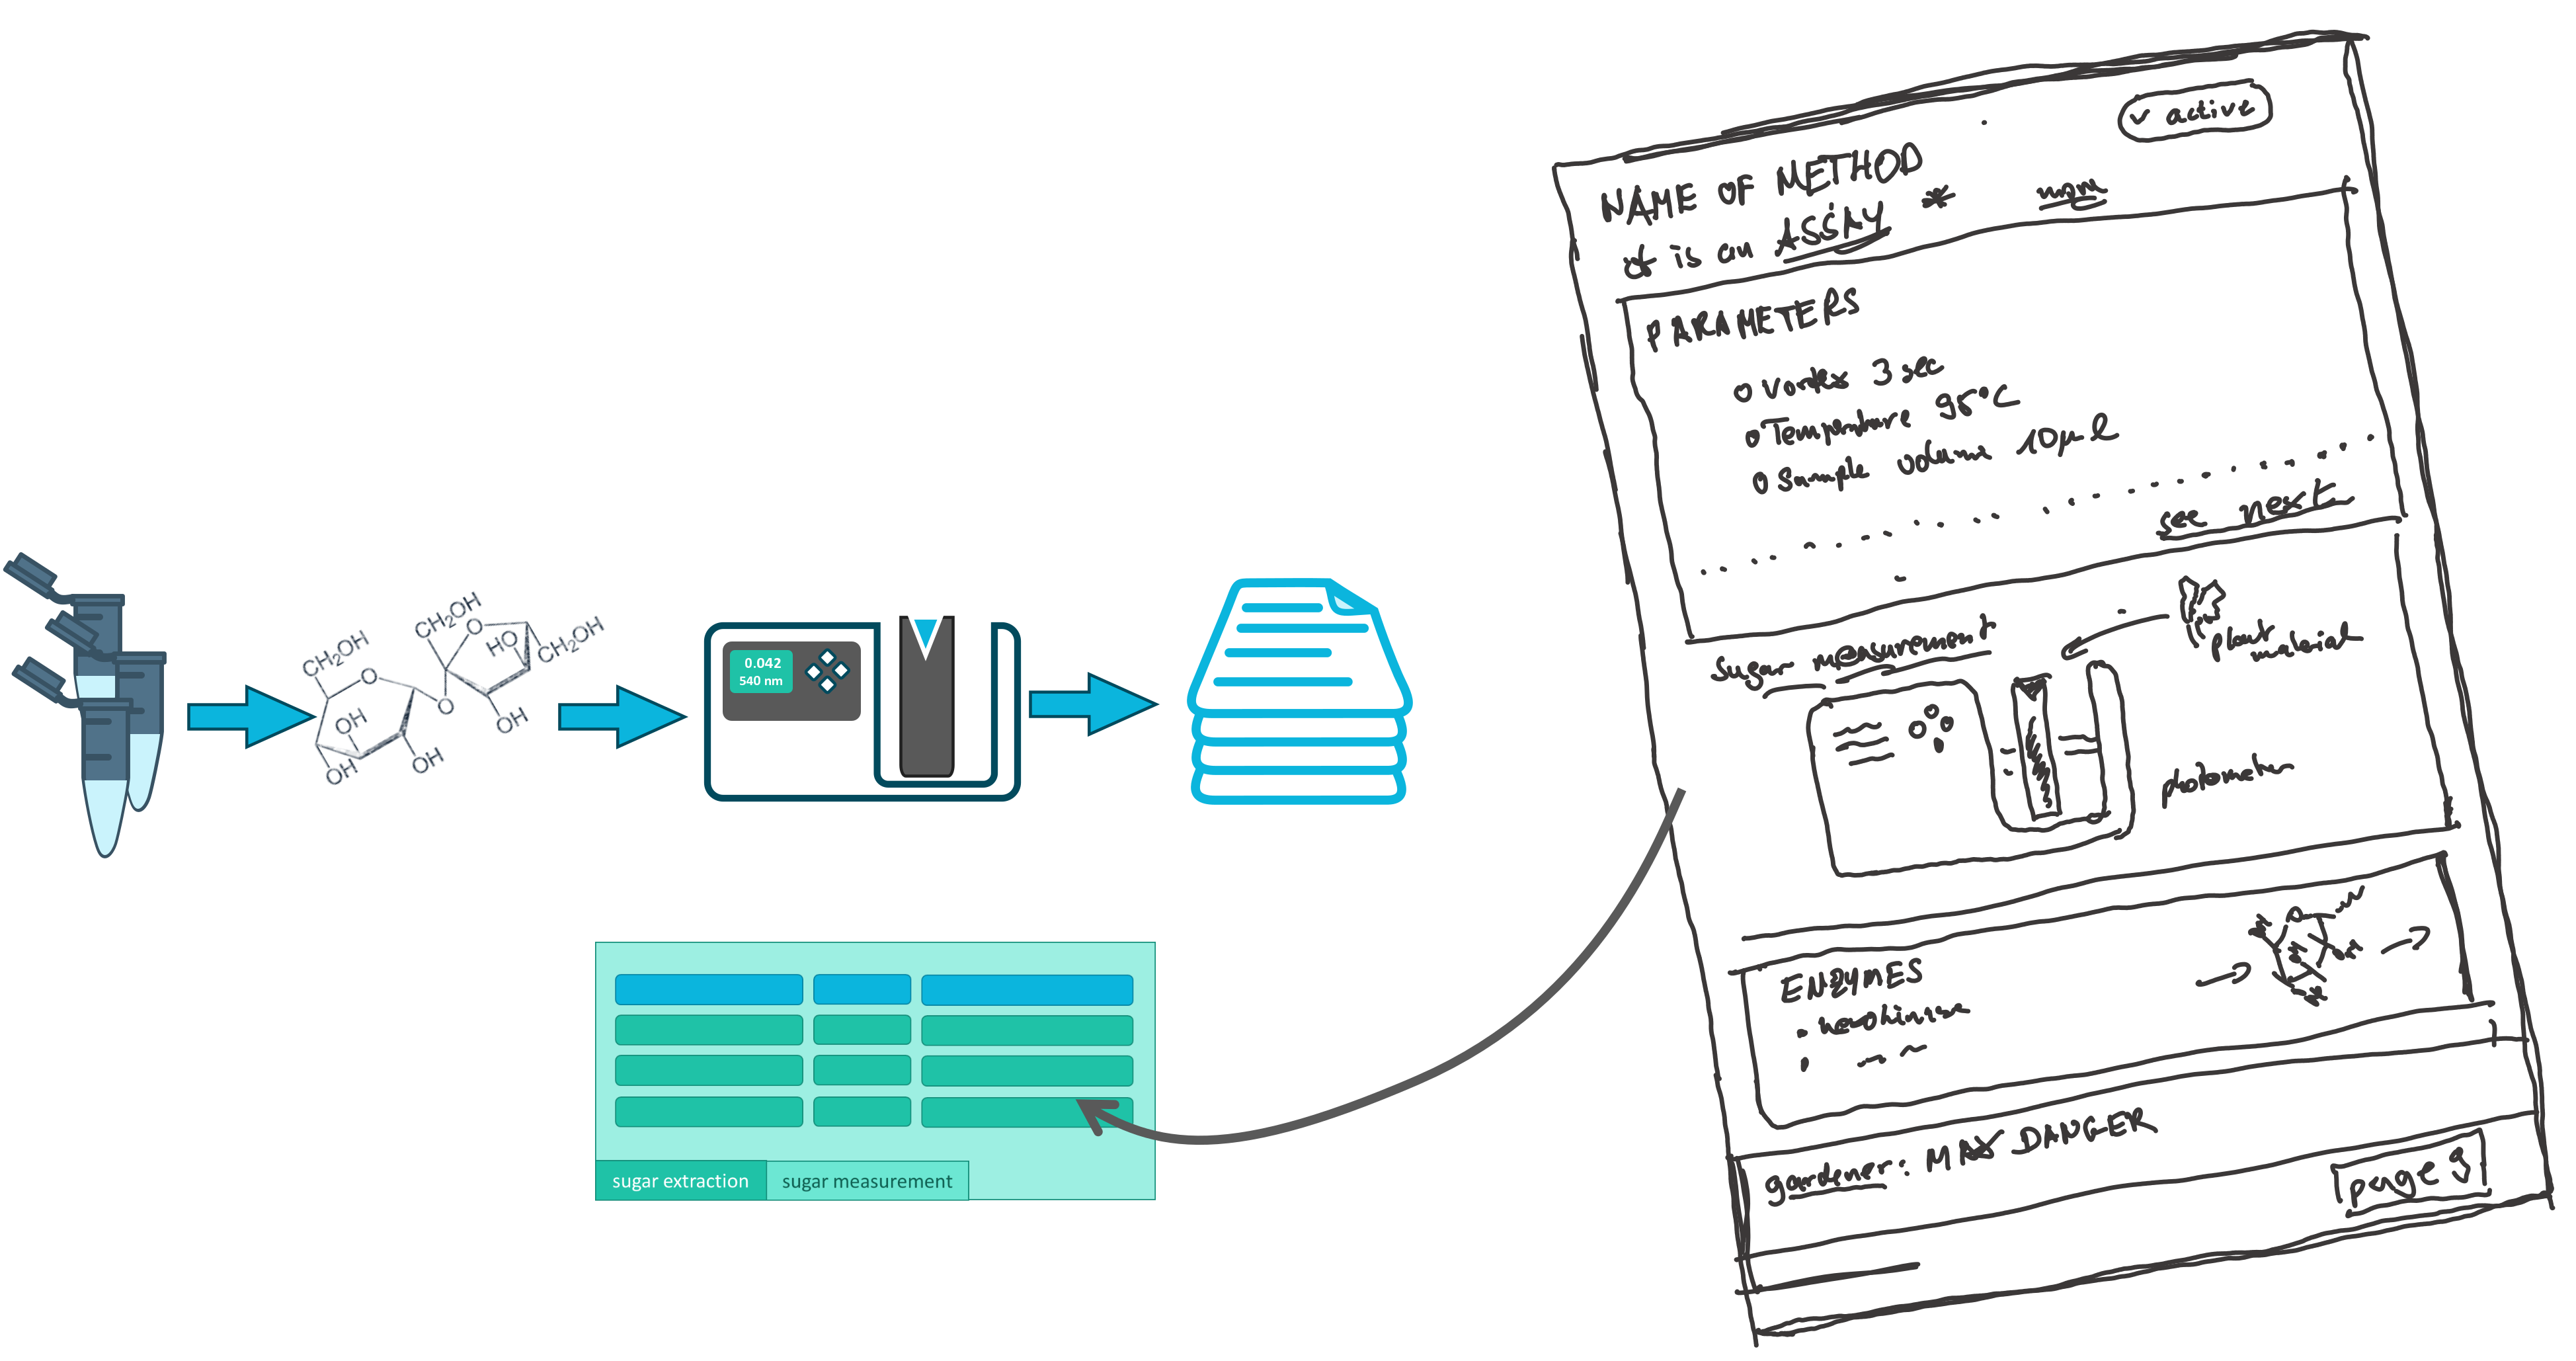
Add a new assay
Section titled “Add a new assay”-
Click on the plus icon add next to storage
assaysto add a new assay. -
Enter a name for the
New Assay.SugarMeasurement
-
Click
New Assay. -
ARCitect adds the assay
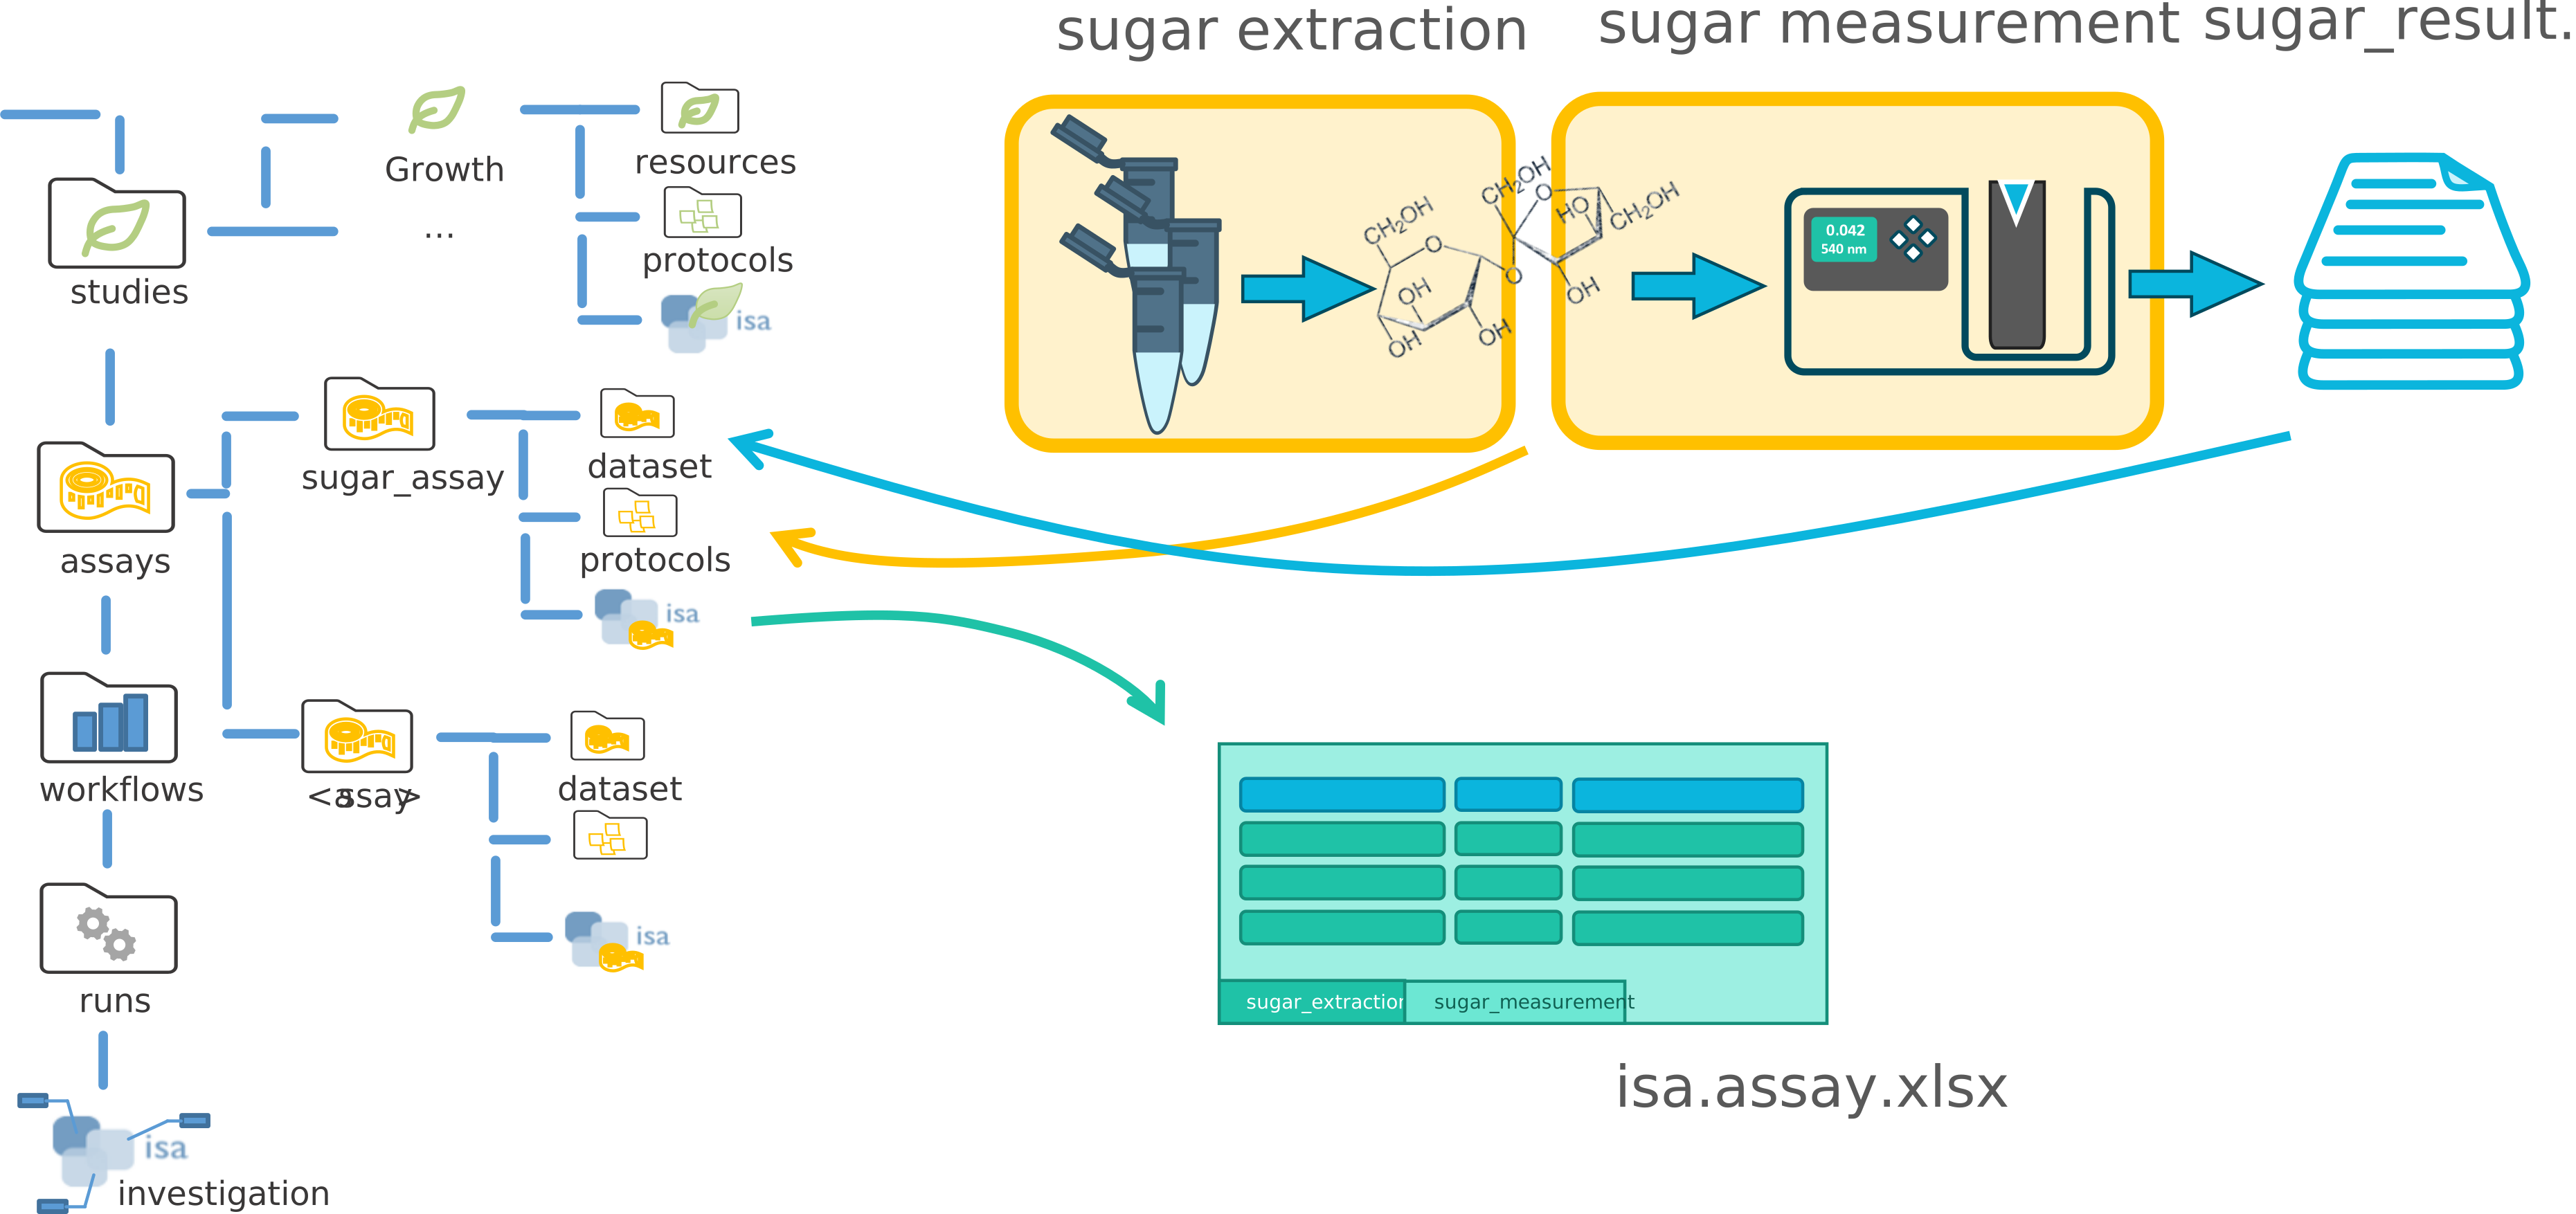
SugarMeasurementincluding the foldersdatasetandprotocolsas well as aREADME.mdand theisa.assay.xlsxworkbook. You can display the file structure created by ARCitect by clicking onSugarMeasurementas shown below.Directoryassays
DirectorySugarMeasurement
Directorydataset
- …
Directoryprotocols
- …
- isa.assay.xlsx
- README.md
- …
-
Click on the assay’s name (
SugarMeasurement) in the file tree to edit the assay metadata in the right panel. -
Here you can add metadata about your assay.
Ok, so my measurement type is “sugar measurement”. And to specify the device I used for my measurement, I add “photometry” and “Infinite M200 plate reader (Tecan)” as the technology type and technology platform, respectively.
-
Click on the plus icon next to
assaysto add a new assay. -
Enter an identifier for the
New Assay.SugarMeasurement
-
Click
Create Assay. -
ARCitect-GX adds the assay
SugarMeasurementincluding the foldersdatasetandprotocolsas well as aREADME.mdand theisa.assay.xlsxworkbook. You can display the file structure created by ARCitect-GX by clicking onSugarMeasurementas shown below.Directoryassays
DirectorySugarMeasurement
Directorydataset
- …
Directoryprotocols
- …
- isa.assay.xlsx
- README.md
- …
-
Click on the assay’s name (
SugarMeasurement) in the file tree to open the folder -
Click on the
isa.assay.xlsxworkbook to edit the assay metadata in the right panel. -
Here you can add metadata about your assay.
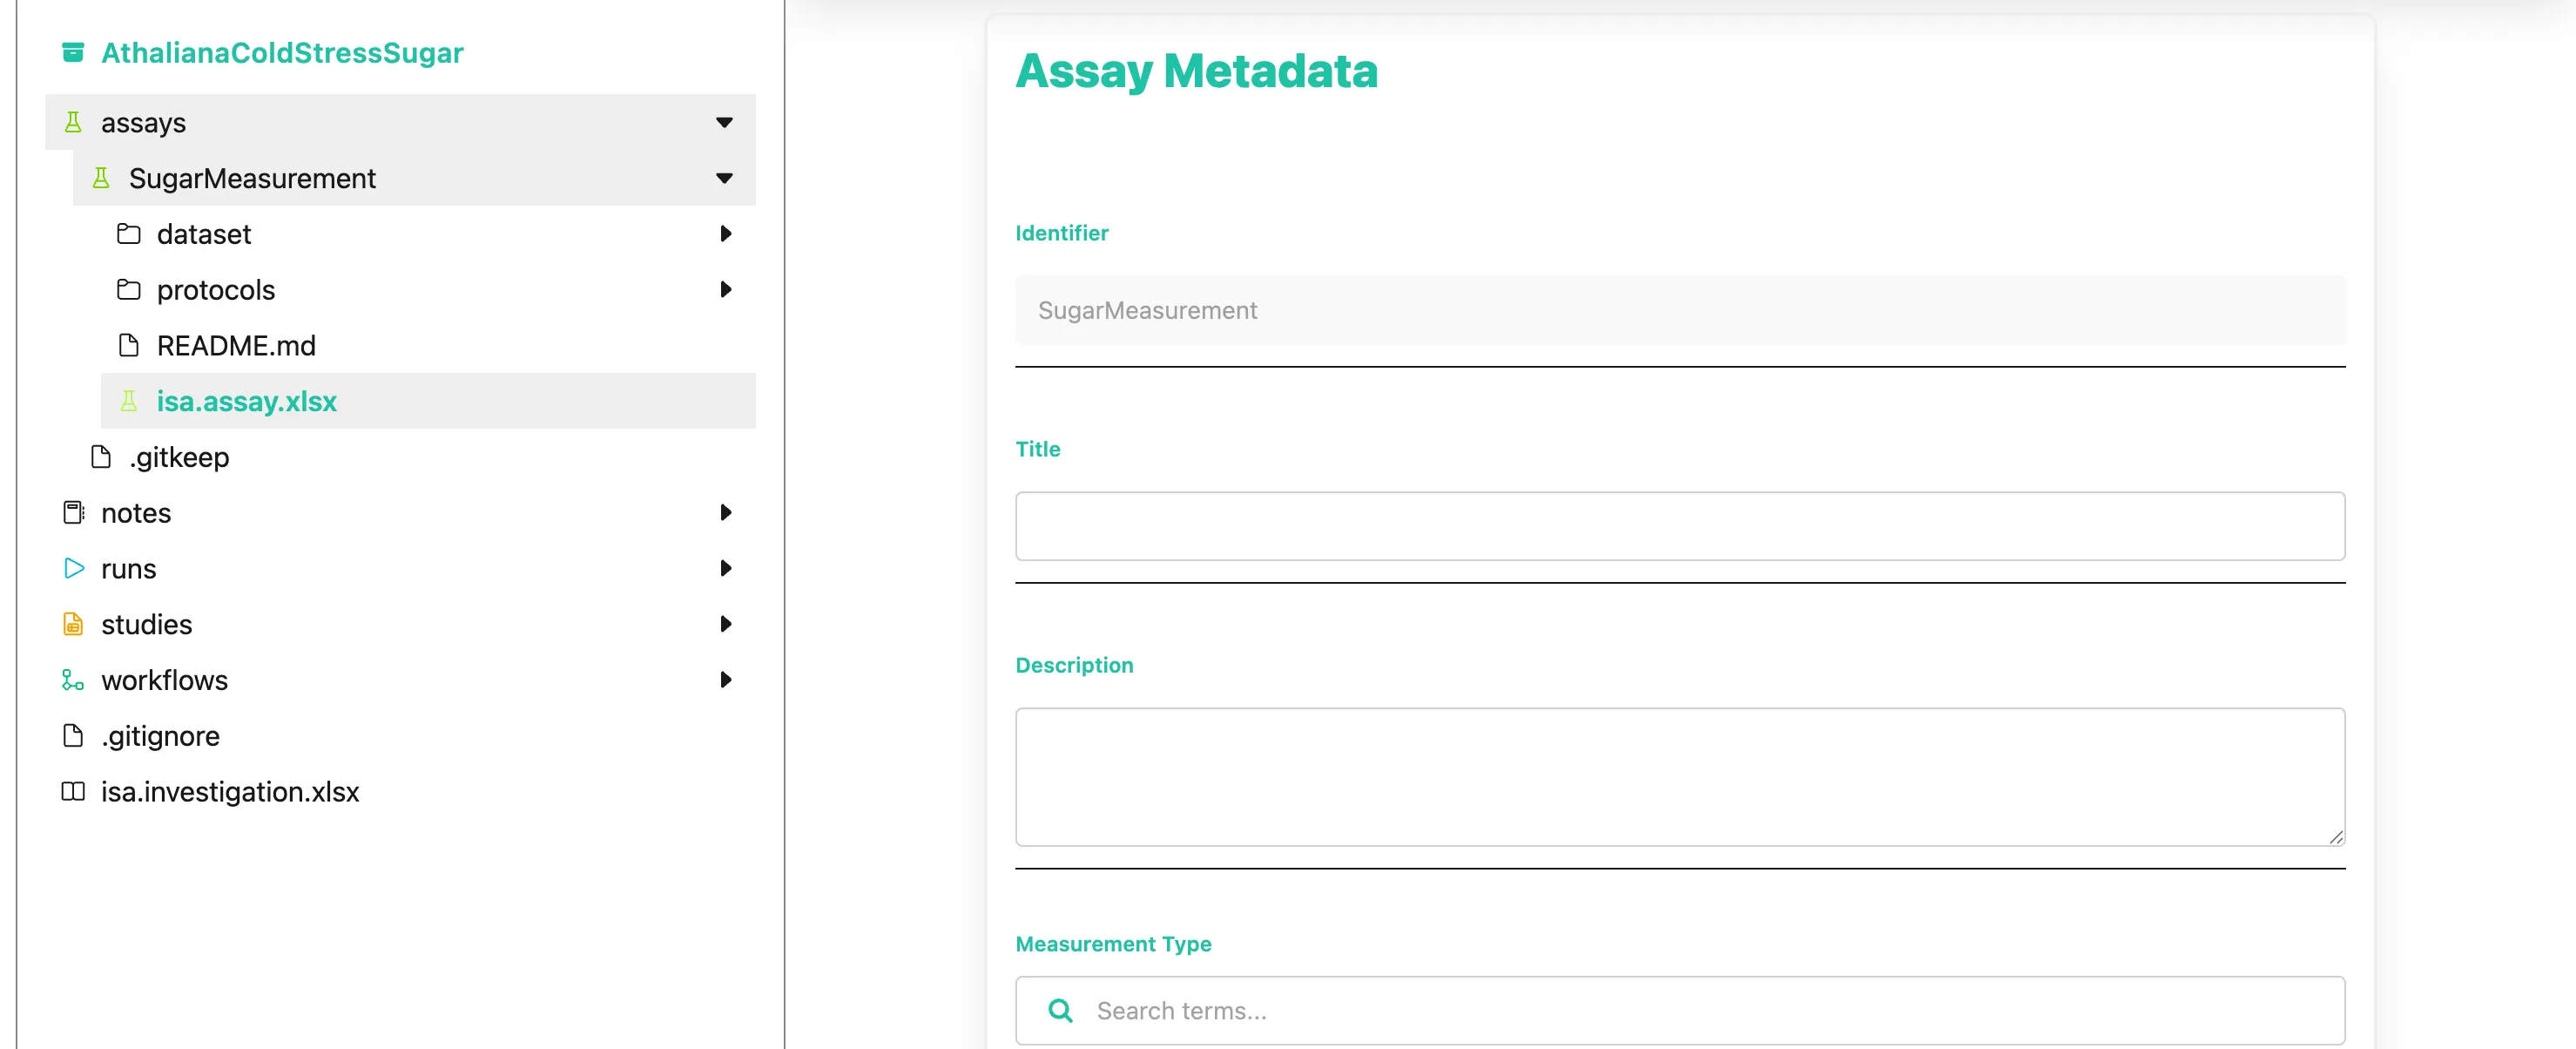
Ok, so my measurement type is “sugar measurement”. And to specify the device I used for my measurement, I add “photometry” and “Infinite M200 plate reader (Tecan)” as the technology type and technology platform, respectively.
Separate different assay elements
Section titled “Separate different assay elements”Just as with studies, the individual assay elements (protocols, data, metadata) find a specific place in the assay subfolders. This enhances the reusability and identification of each element.
Add assay data and protocols
Section titled “Add assay data and protocols”-
Right-click on the
datasetfolder and selectImport Files. -
Select the file
sugar_result.csvfrom the demo data and clickOpen. -
Right-click on the
protocolsfolder and selectImport Files. -
Select the file
sugar_extraction_protocol.mdfrom the demo data and clickOpen. -
The files are added to your ARC.
Directoryassays
DirectorySugarMeasurement
Directorydataset
- sugar_result.csv
Directoryprotocols
- sugar_extraction_protocol.md
- isa.assay.xlsx
- README.md
- …
- Right-click on the
SugarMeasurementfolder and selectOpen Folder Location. - Move the demo data files:
-
sugar_result.csvintodataset -
sugar_extraction_protocol.mdintoprotocolsDirectoryassays
DirectorySugarMeasurement
Directorydataset
- sugar_result.csv
Directoryprotocols
- sugar_extraction_protocol.md
- isa.assay.xlsx
- README.md
- …
-
Isolate the lab processes in an assay
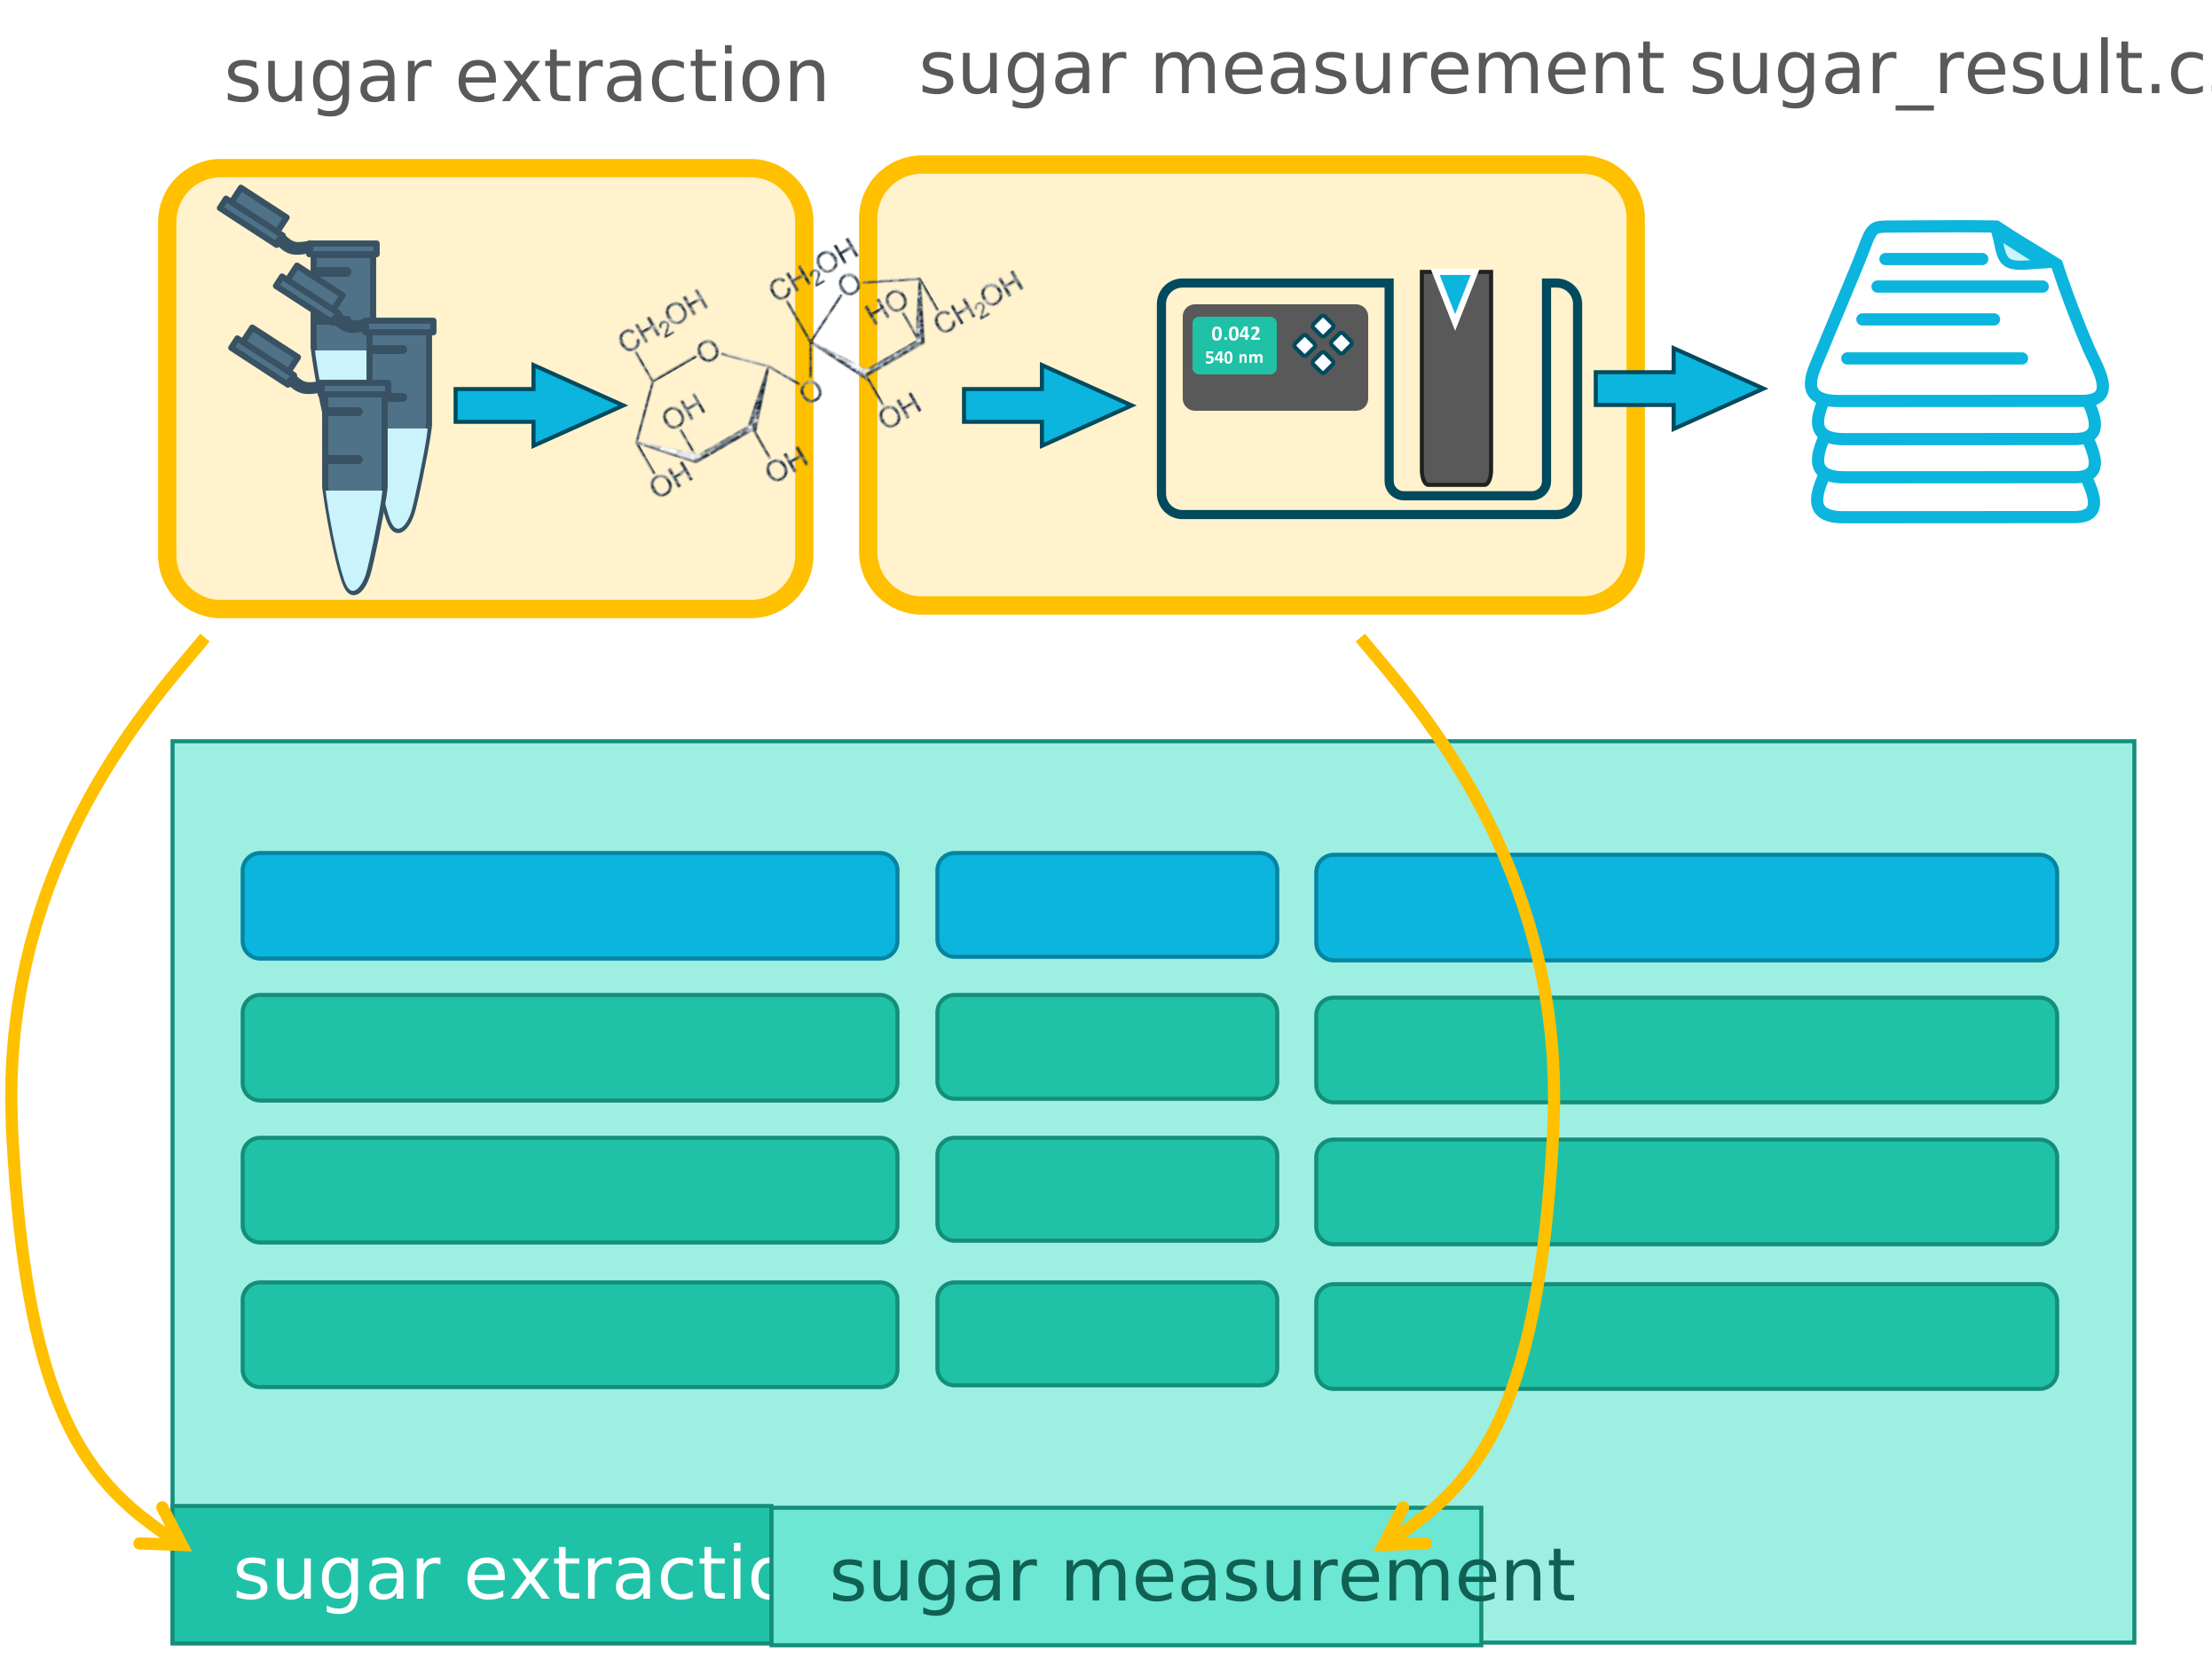
Section titled “Isolate the lab processes in an assay”In order to separate the metadata, we can add one annotation table for each isolated process.
-
Click on the assay’s name (
SugarMeasurement) in the file tree. -
At the bottom of the right panel, click on the
+right next to theAssaysheet to add one sheet for each lab process.I add two tables: one for “SugarExtraction” and one for “SugarMeasurement”
-
After adding the tables, right-click on each sheet’s tab to rename them accordingly.
Use templates to describe the lab processes
Section titled “Use templates to describe the lab processes”Sugar extraction
Section titled “Sugar extraction”We annotate the Sugar extraction process first.
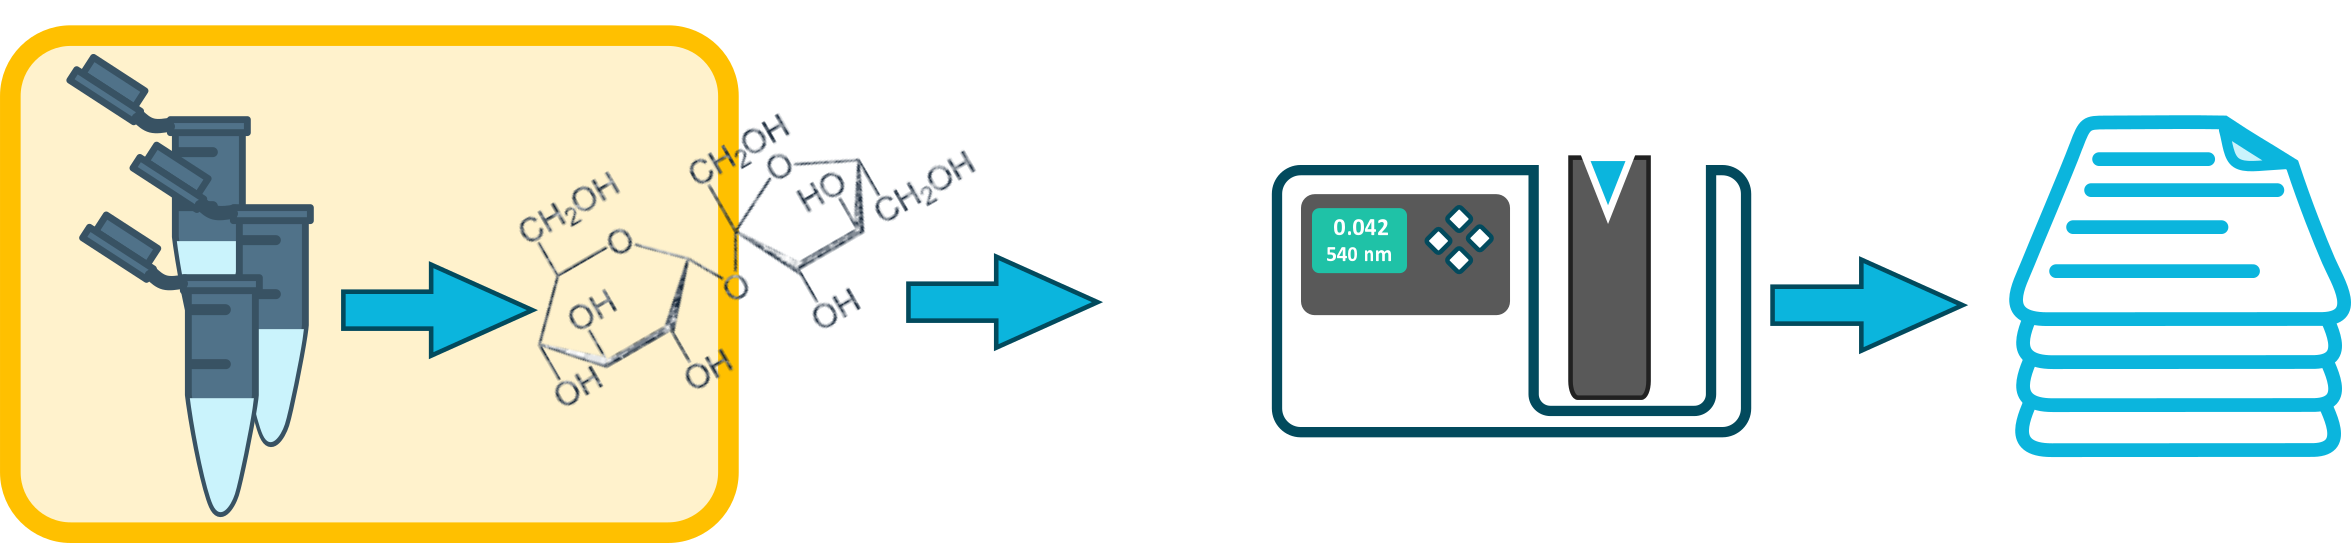
Similar to the study example, we can parameterize the individual process steps, for instance:
-
Vortex Mixer 3 seconds
-
Temperature 95 degree celsius
Instead of adding each individual building block to the table, we can use a generic template for a sugar extraction.
-
Click on the assay’s name (
SugarMeasurement) in the file tree. -
Select the “SugarExtraction” table added in the previous step.
-
In the
New Table!widget, click toStart with template!. This will show you all DataPLANT curated templates. -
To select a template from a different community click .
-
From the dropdown, select “Training” and deselect “DataPLANT”.
-
Click on the template
Training - Sugar extraction. -
Click
Import Templates. -
Configure
Import Typeto..With UnitsandSugarExtractiontoAppend to active table. -
You can expand
Preview Selected Columnsto view all building blocks of the template.This shows me that the template has an Input, Output as well as two Parameter columns: “Vortex Mixer” and “Temperature”
-
Click
Submitto use the template.Input [Sample Name] Parameter [Vortex Mixer] Parameter [Temperature] Output [Sample Name] -
At the bottom of the table, type
5in the text field and click+to add 6 rows to your table for a total of 6 since one was added automatically. -
Transfer the sample names of your study’s
Output [Sample Name]to theInput [Sample Name]column.Input [Sample Name] Parameter [Vortex Mixer] Parameter [Temperature] Output [Sample Name] Cold1_leaf Cold2_leaf Cold3_leaf RT1_leaf RT2_leaf RT3_leaf -
Add information of the
sugar_extraction_protocol.mdinto the table, e.g.Input [Sample Name] Parameter [Vortex Mixer] Parameter [Temperature] Output [Sample Name] Cold1_leaf 3 seconds 95 degree celsius Cold2_leaf 3 seconds 95 degree celsius Cold3_leaf 3 seconds 95 degree celsius RT1_leaf 3 seconds 95 degree celsius RT2_leaf 3 seconds 95 degree celsius RT3_leaf 3 seconds 95 degree celsius -
Fill the
Output [Sample Name]column:- Select the six cells from
Input, and copy the sample names (right-click -> Copy) - Select the cells below
Output [Sample Name]and paste the sample names (right-click -> Paste) - Right-click a cell in the column
Output [Sample Name]. Then selectEditandUpdate Rowsin the opened field to update all rows at once. - Type “leaf” in the
Regexand “sugar-ext” in theReplacementfields - Click
Submit
Input [Sample Name] Parameter [Vortex Mixer] Parameter [Temperature] Output [Sample Name] Cold1_leaf 3 seconds 95 degree celsius Cold1_sugar-ext Cold2_leaf 3 seconds 95 degree celsius Cold2_sugar-ext Cold3_leaf 3 seconds 95 degree celsius Cold3_sugar-ext RT1_leaf 3 seconds 95 degree celsius RT1_sugar-ext RT2_leaf 3 seconds 95 degree celsius RT2_sugar-ext RT3_leaf 3 seconds 95 degree celsius RT3_sugar-ext - Select the six cells from
Sugar measurement
Section titled “Sugar measurement”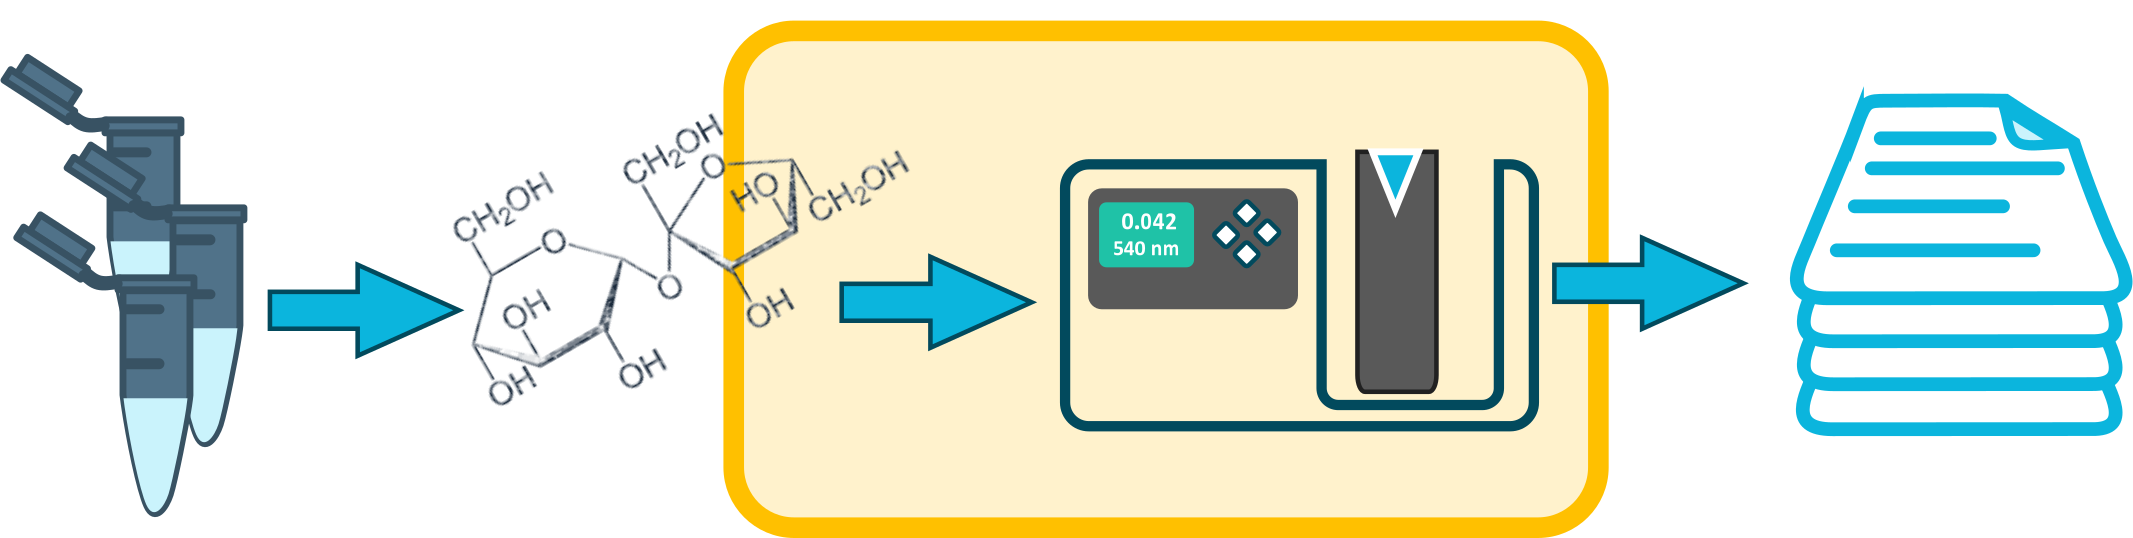
We follow the same steps to fill the Sugar Measurement table.
-
Select the “SugarMeasurement” table.
-
Click
Utilize prior outputandImport selected output columnto use the (*_sugar-ext) values of the “SugarExtraction” table. -
Click on the button in the top bar and import the template
Training - Sugar measurement, following the same steps as before. this will not replace the existing input column. -
Fill the parameter columns
- Parameter [
technical replicate] of 1,2,3,1,2,3 - Parameter [
sample volume] of 10microliter - Parameter [
buffer volume] of 190microliter - Parameter [
cycle count] of 5
- Parameter [
-
Use the
File Pickerfeature to import the results of sugar measurement (sugar_result.csv) intoOutput [Data]Input [Sample Name] Parameter [technical replicate] Parameter […] Output [Data] Cold1_sugar-ext 1 … ./assays/SugarMeasurement/dataset/sugar_result.csv Cold2_sugar-ext 2 … ./assays/SugarMeasurement/dataset/sugar_result.csv Cold3_sugar-ext 3 … ./assays/SugarMeasurement/dataset/sugar_result.csv RT1_sugar-ext 1 … ./assays/SugarMeasurement/dataset/sugar_result.csv RT2_sugar-ext 2 … ./assays/SugarMeasurement/dataset/sugar_result.csv RT3_sugar-ext 3 … ./assays/SugarMeasurement/dataset/sugar_result.csv
Linking samples to data – across studies and assays
Section titled “Linking samples to data – across studies and assays”Following the simple approach of reusing sample and data identifiers in different parts of the ARC, we were able to concisely link the samples through the different lab processes in studies and assays to the data produced from those samples.
Source
flowchart TDclassDef studyStyle fill:#dae7c1,rx:.4em,ry:.4em,color:#2d3e50,stroke:#2d3e50,font-weight:bold;classDef assayStyle fill:#ffe080,rx:.4em,ry:.4em,color:#2d3e50,stroke:#2d3e50,font-weight:bold;classDef processStyle fill:#E08F9C,rx:.4em,ry:.4em,color:#2d3e50,stroke:#2d3e50,font-weight:normal;classDef sampleStyle fill:#FEFEFE,rx:.4em,ry:.4em,color:#2d3e50,stroke:#2d3e50,font-weight:normal;classDef dataStyle fill:#FEFEFE,rx:.4em,ry:.4em,color:#2d3e50,stroke:#2d3e50,font-weight:normal;subgraph study1["Study:AthalianaColdStress"] s1[Plants] ---p1[Plant-growth]--> s2[Leaves]endsubgraph assay1[Assay1:SugarMeasurement] s2 ---p2[SugarExtraction]--> s3[Sugar extract] s3 ---p3[SugarMeasurement]--> d1@{ shape: doc, label: sugar_result.csv}endclass study1 studyStyle;class assay1 assayStyle;class p1,p2,p3 processStyle;class s1,s2,s3 sampleStyle;class d1 dataStyle;