Add a datamap

The data file “sugar_result.csv” I added earlier contains multiple columns, but in the assay annotation, I just pointed to the file. Is there a way to specify which column belongs to which sample?
Yes! For this, you can make use of data fragment selectors.
There exist various different file formats and each requires its own format for annotating fragments as well. In this case, we have a tabular file format, for which our tooling provides help.
Point into results – Fragment selectors
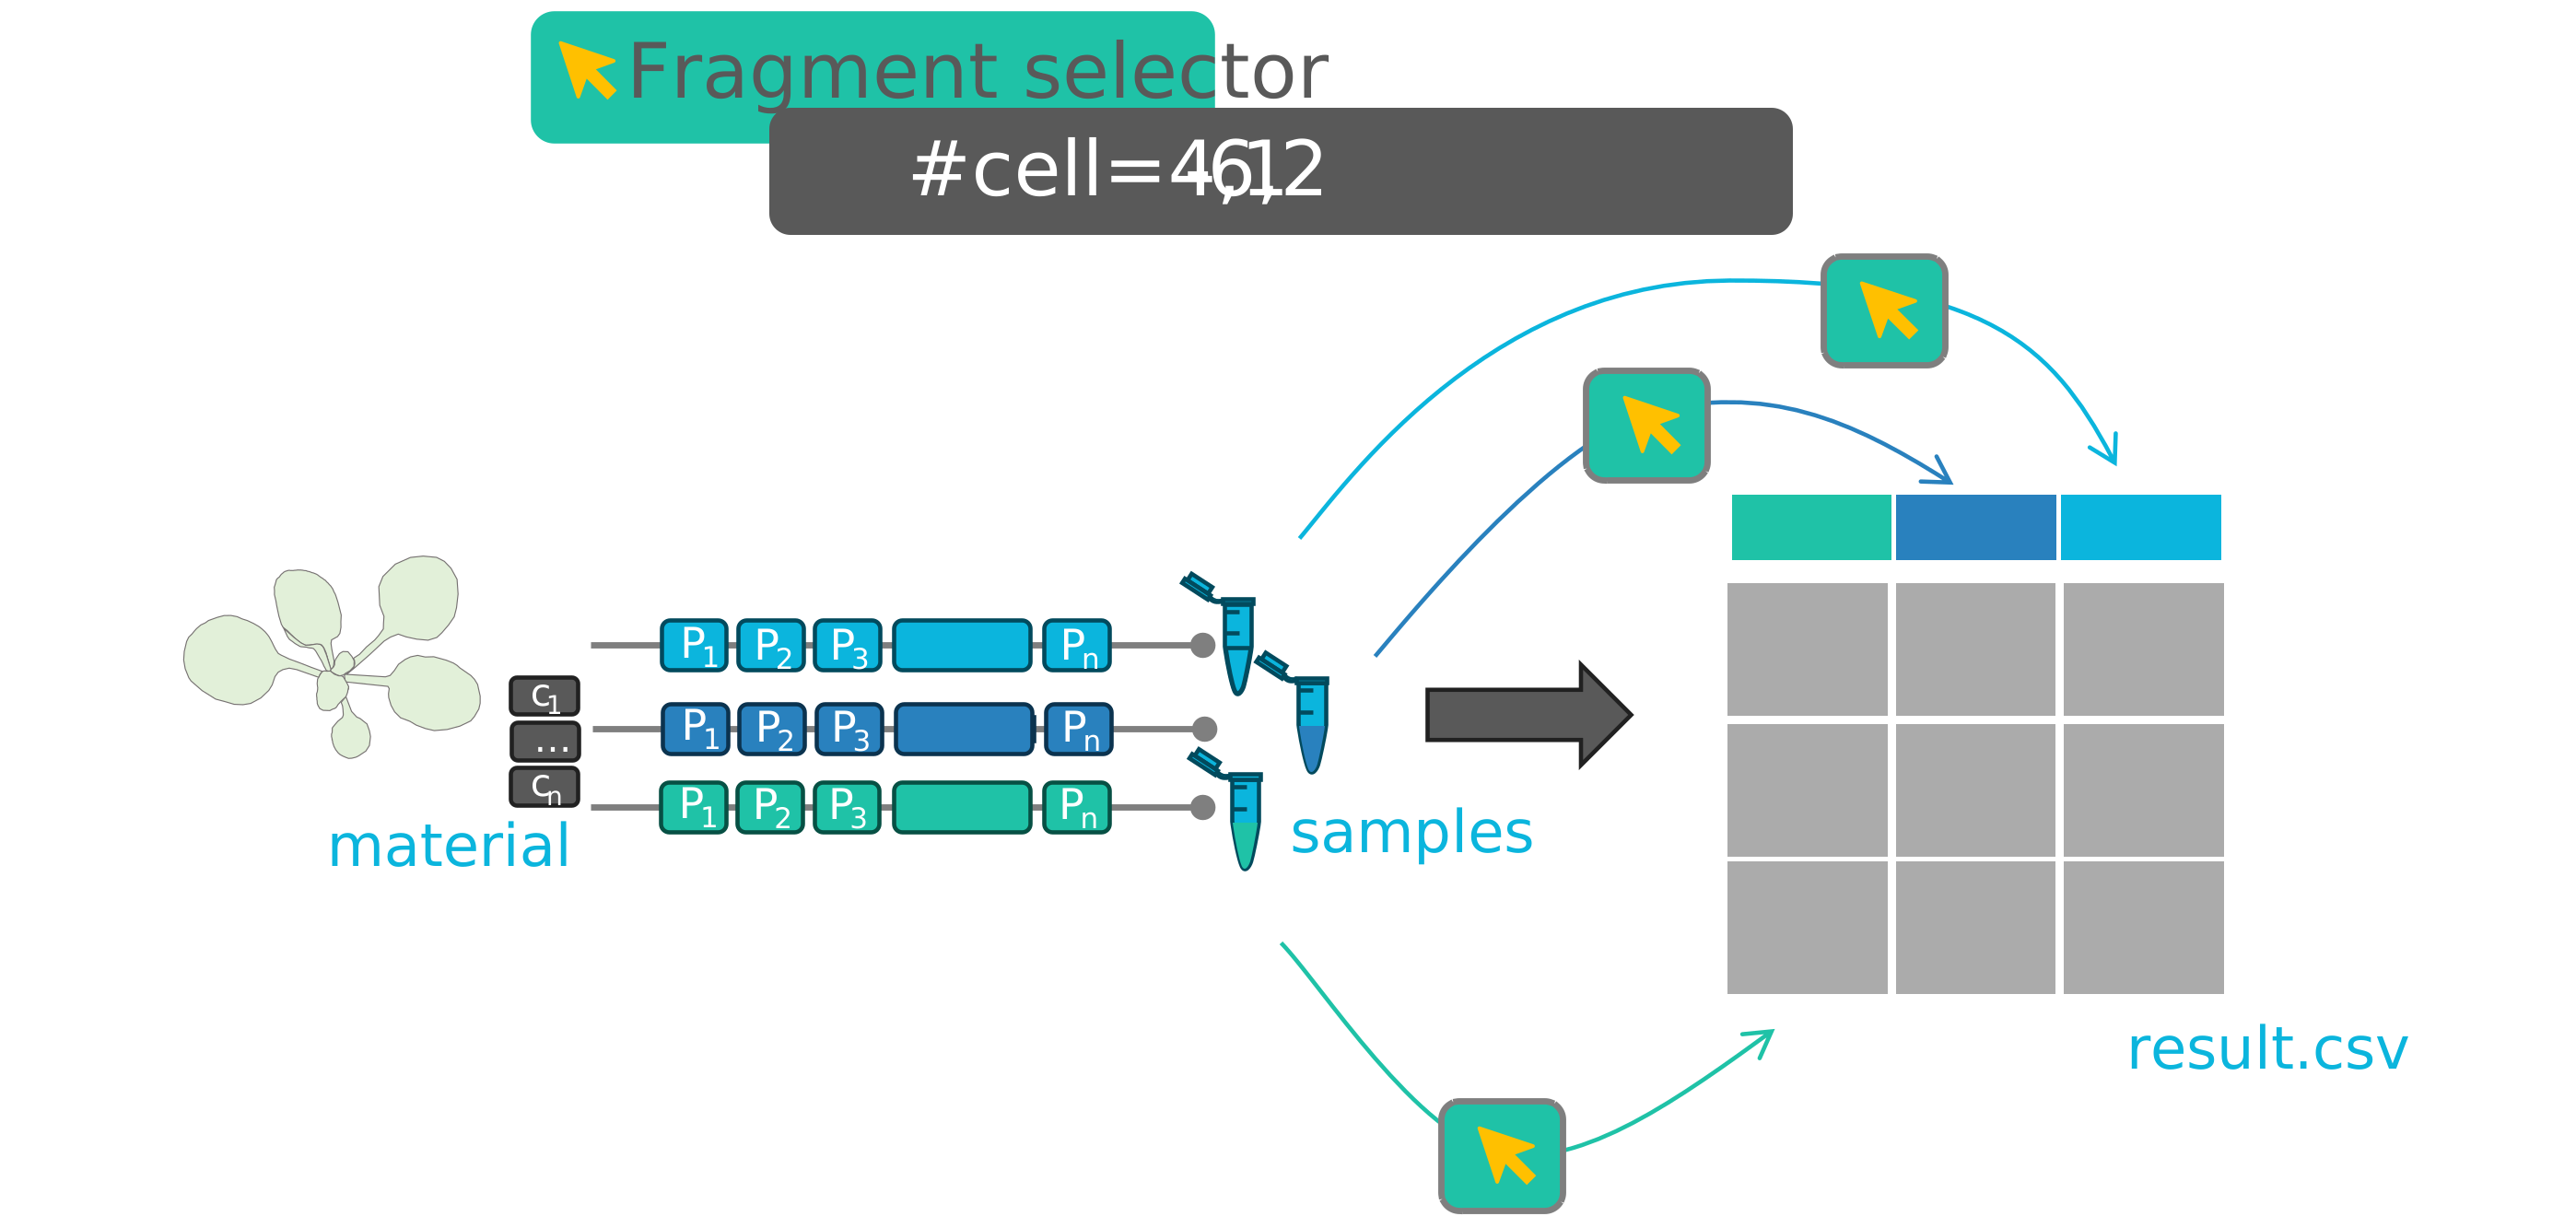
Section titled “Point into results – Fragment selectors”We will now add fragment selectors to the previously created annotation table to connect our sample to specific data points. This way, provenance is persistently tracked. Data scientists down the line will thank you for the increase in machine-actionability.
-
In the “SugarsPhotometer” assay, open the “Sugar Measurement” table
-
On top of the annotation table, open the “Data Annotator” tool
-
Click
Choose File, find and selectsugar_result.csvand clickPreview and Select Targets -
Select only the 6(!) Data columns (
RT_M1,RT_M2,RT_M3,Cold_M1,Cold_M2,Cold_M3). These are the direct results of the 6 samples. -
Click
Add selectors -
Select the corresponding cells in the
Output [Data]column and clickInsert selectorsInput [Sample Name] Parameter […] Output [Data] Cold1_sugar-ext … sugar_result.csv#col=2 Cold2_sugar-ext … sugar_result.csv#col=3 Cold3_sugar-ext … sugar_result.csv#col=4 RT1_sugar-ext … sugar_result.csv#col=5 RT2_sugar-ext … sugar_result.csv#col=6 RT3_sugar-ext … sugar_result.csv#col=7
DataMAP: Annotation for the fragment selectors
Section titled “DataMAP: Annotation for the fragment selectors”Wow, this is very verbose, even though it only took a few clicks! And you say data scientists will now finally be content?
Yes, but with a final bit of annotation you might even raise a smile from them. Using data fragment selectors in the annotation table, you described the provenance between your samples and your data fragments.
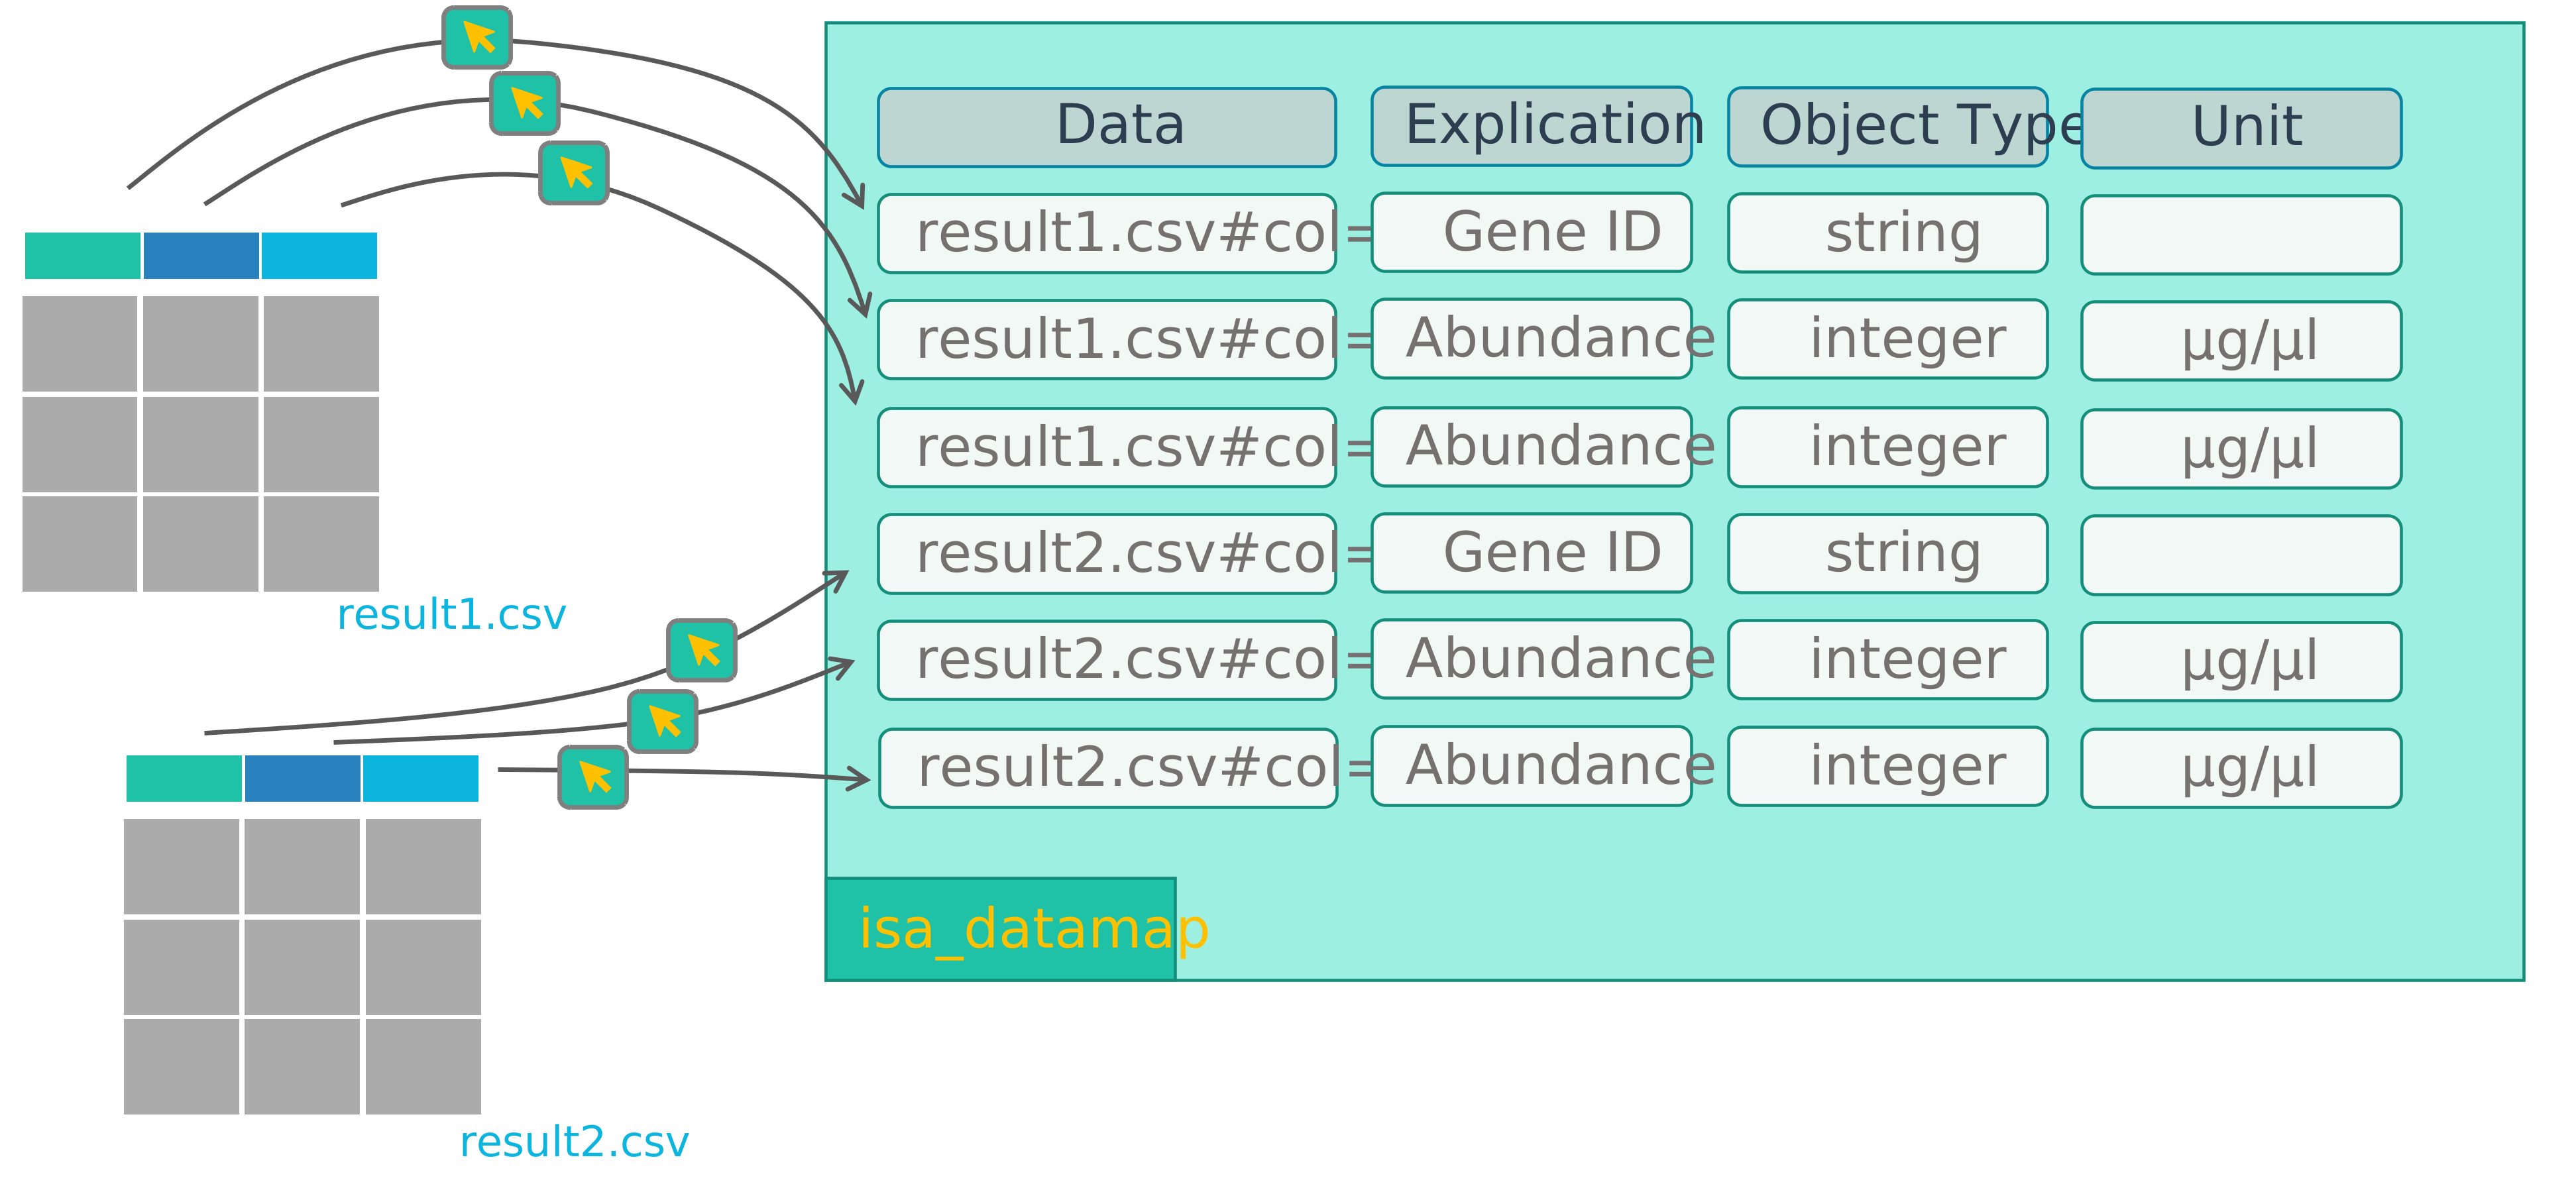
In addition, you can further annotate these data fragments and even those which do not directly originate from any of the samples. For example, the column containing the names of the sugars. This annotation is done in the datamap.
We’ll now use the datamap to annotate all columns in the file, even the ones we didn’t cover in the annotation table.
-
In the file tree, right-click the
SugarsPhotometerassay and selectAdd Datamap -
Open the
isa.datamap.xlsxfile from the file tree or select theDataMapsheet at the table bottom -
Open the “Data Annotator” tool on top and select the same file (
sugar_result.csv) as before. -
This time select all 7 columns and click
Add selectors -
Add 7 rows to the table, and
Insert selectorsto theInput [Data]column. -
Add the following annotation to describe the columns in “sugar_result.csv”
The first column of my result table “sugar_result.csv” contains the name of the measured sugar, that is the molecule name. The other six columns contain the measured data: molecule count in mmol / kg.
Data … Explication Unit Object Type sugar_result.csv#col=1 … molecule name string sugar_result.csv#col=2 … molecule count Millimole per kilogram Float sugar_result.csv#col=3 … molecule count Millimole per kilogram Float sugar_result.csv#col=4 … molecule count Millimole per kilogram Float sugar_result.csv#col=5 … molecule count Millimole per kilogram Float sugar_result.csv#col=6 … molecule count Millimole per kilogram Float sugar_result.csv#col=7 … molecule count Millimole per kilogram Float